STA/OPR 9750 - Week 8
STA/OPR 9750 Mini-Project #02
Submission due yesterday at 11:45pm
Y’all have it out for The Shawshank Redemption…
- Very entertained by fake posters
- Impressive graphics and analysis - very nice.
The Shark!
STA/OPR 9750 Mini-Project #02
Add the following to your .gitignore file:
/.quarto/
.Rproj.user
*/*_cache/*
*tsv*
*csv*
*xlsx*
*zip
*gz
.DS_Store
.Rhistory
This instructs git to ignore matching files - less chance of accidental “super commits.”
(Possible to override if you necessary)
STA/OPR 9750 Mini-Project #02 - Peer Feedback
Peer feedback assigned on GitHub this morning
- \(\approx 4\) feedbacks each
- Take this seriously: around 20% of this assignment is “meta-review”
- Goal: rigorous constructive critique
Submissions may not map perfectly to rubric - use your best judgement
Learn from this! What can you adapt for MP#03?
STA/OPR 9750 Mini-Project #03
Now online
Due November 13th
GitHub post (used for peer feedback) AND Brightspace
Three Weeks: don’t wait until the very end
-
Should be less demanding than MP #01 and MP#02
- Lots of little files. No big files!
- Maps and election retrodiction
Pay attention to the rubric
Thank You!
Thank you!
A personal note, if you allow me:
I’m really enjoying this class - thank you all!
Your effort is not unnoticed - I know this class starts “pedal-to-the-metal” but hopefully you’ve seen just how powerful these tools R.
More than that - I appreciate your good attitude and willingness to share your frustrations and triumphs. Reading comments on PA quiz this week was uplifting.
Continual Improvement
I’ve set up a TODO file with everything I want to improve for next cohort.
Suggestions welcome.
I will also ask Charles to distribute an opportunity for anonymous feedback.
Going Forward
Upcoming Mini-Projects
Tentative Topics
- MP#04: Something financial
Any requests?
Course Project
Feedback from Charles and from me - I’m behind on returning.
Project should be your main focus for rest of course
- Still need to do mini-projects and pre-assignments
Pre-Assignments
Brightspace - Wednesdays at 11:45
- Reading, typically on course website
- Brightspace auto-grades
- I have to manually change to completion grading
Next pre-assignment is October 30th
Thank you for FAQs and (honest) team feedback. Keep it coming!
Course Support
- Synchronous
- Office Hours 4x / week
- MW Office Hours on Monday + Thursday for rest of semester
- CR Tuesday + Friday
- No OH during Thanksgiving break
- Office Hours 4x / week
- Asynchronous
- Piazza (\(<50\) minute average response time)
Upcoming Week
Due Wednesday at 11:45pm:
- Pre-Assignment #09 (Brightspace)
- Data Import
- MP #02 Peer Feedback on GitHub AND Brightspace
Pre-Assignment #08 FAQs
FAQ: ggplot2 - aes()
What is the aes function - stands between data and geom_
- Each
geom_takes a fixed set of “coordinates” - Each data set has its own column names
-
aesties these together
FAQ: ggplot2 - Why do Pie Charts have a bad reputation?
- Use of area and angle over length: less accurate perception
- Depends on
fillto convey category - limited categories
But honestly - “insider smugness” and hate of Excel
FAQ: ggplot2 - Plot Type Choice
For me:
- Exploratory mode:
- Simple: line, scatter, bar, frequency
- Publication mode:
- Very context specific
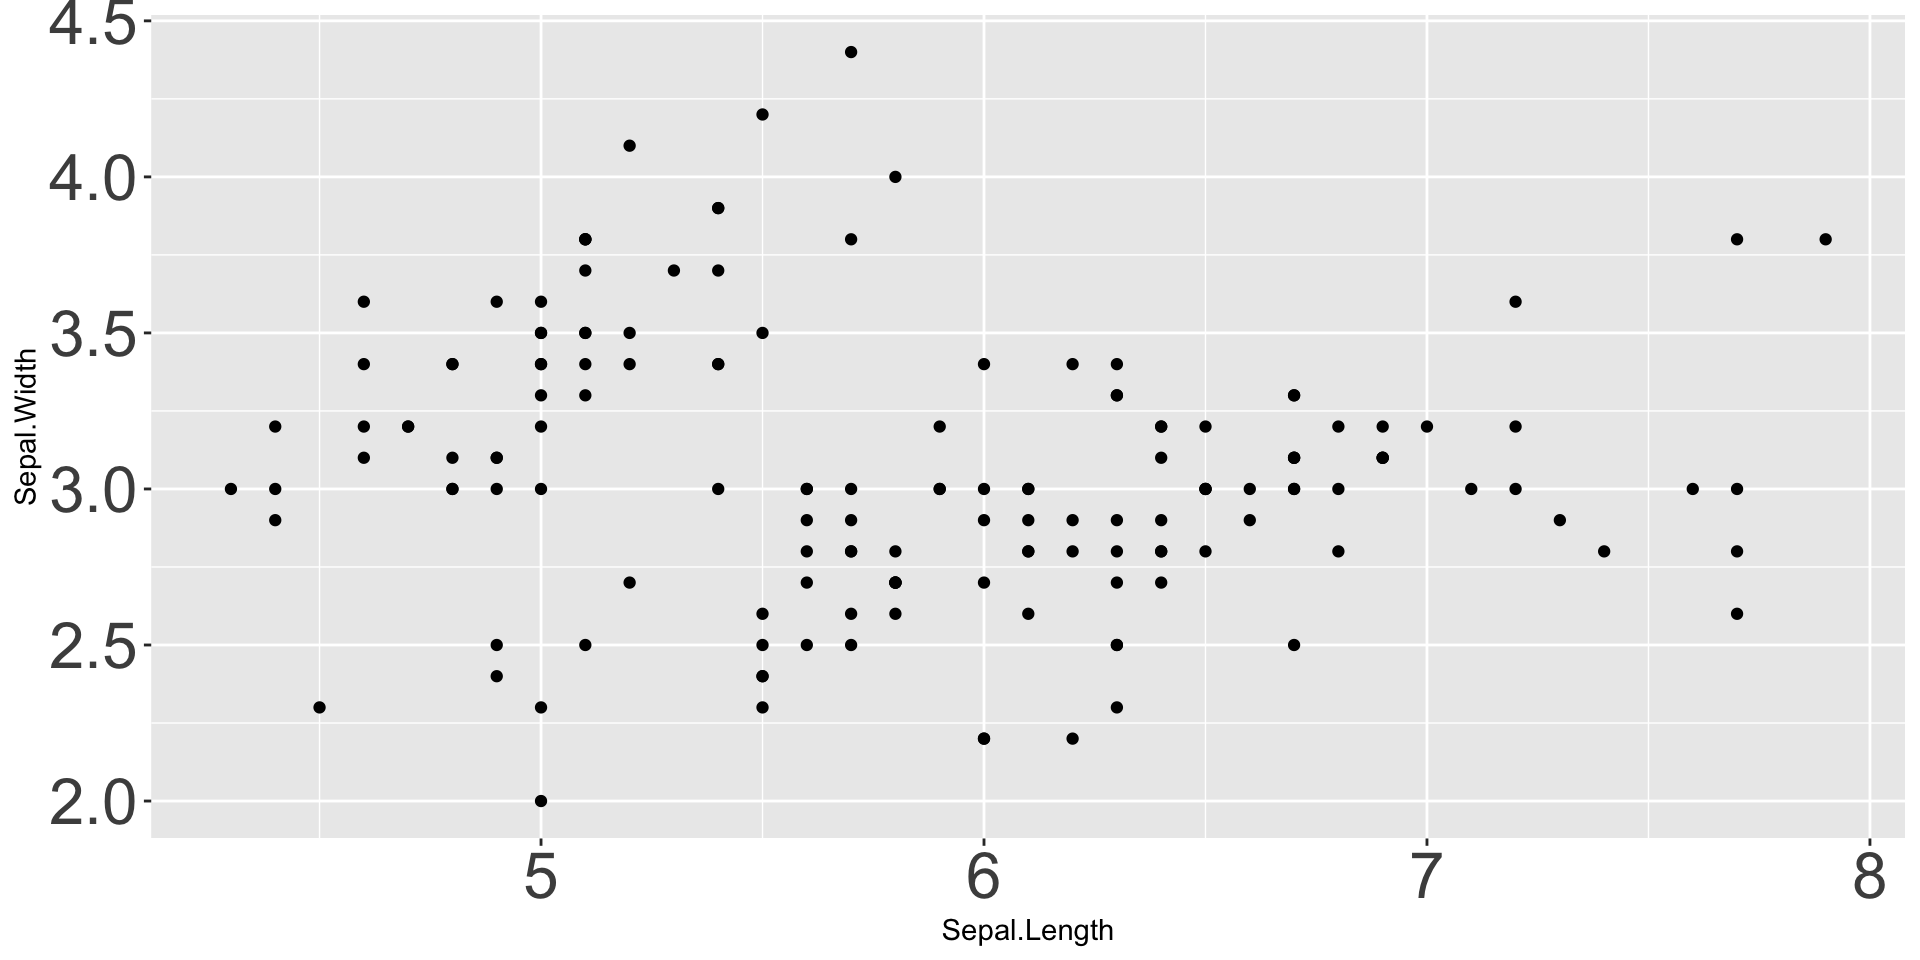
FAQ: ggplot2 - Font Sizing
Theme machinery!
FAQ: ggplot2 - Overplotting / ScatterBlobs
Student asked about “scatterblobs” - typo(?) but I love it!
- Density based plotting: hexbins, histograms, rugplots
- Data reduction: summarization or sub-sampling
FAQ: ggplot2 - Optimizing Performance
Active project of ggplot2 team - not much you can do
Practical advice: plot less (see previous slide)
FAQ: ggplot2 - Beyond Scatter and Line
Some favorite semi-advanced plot types:
- Violin plots: combination of boxplot and histogram
- Ridgelines
- Beeswarms
Deep rabbit hole
FAQ: ggplot2 - Geospatial Visualizations
That’s our goal for today!
FAQ: ggplot2 - High-Dimensional Data
High-dimensional data: measure many variables per observation (“wide”)
High-dimensional data is hard to visualize
Approaches:
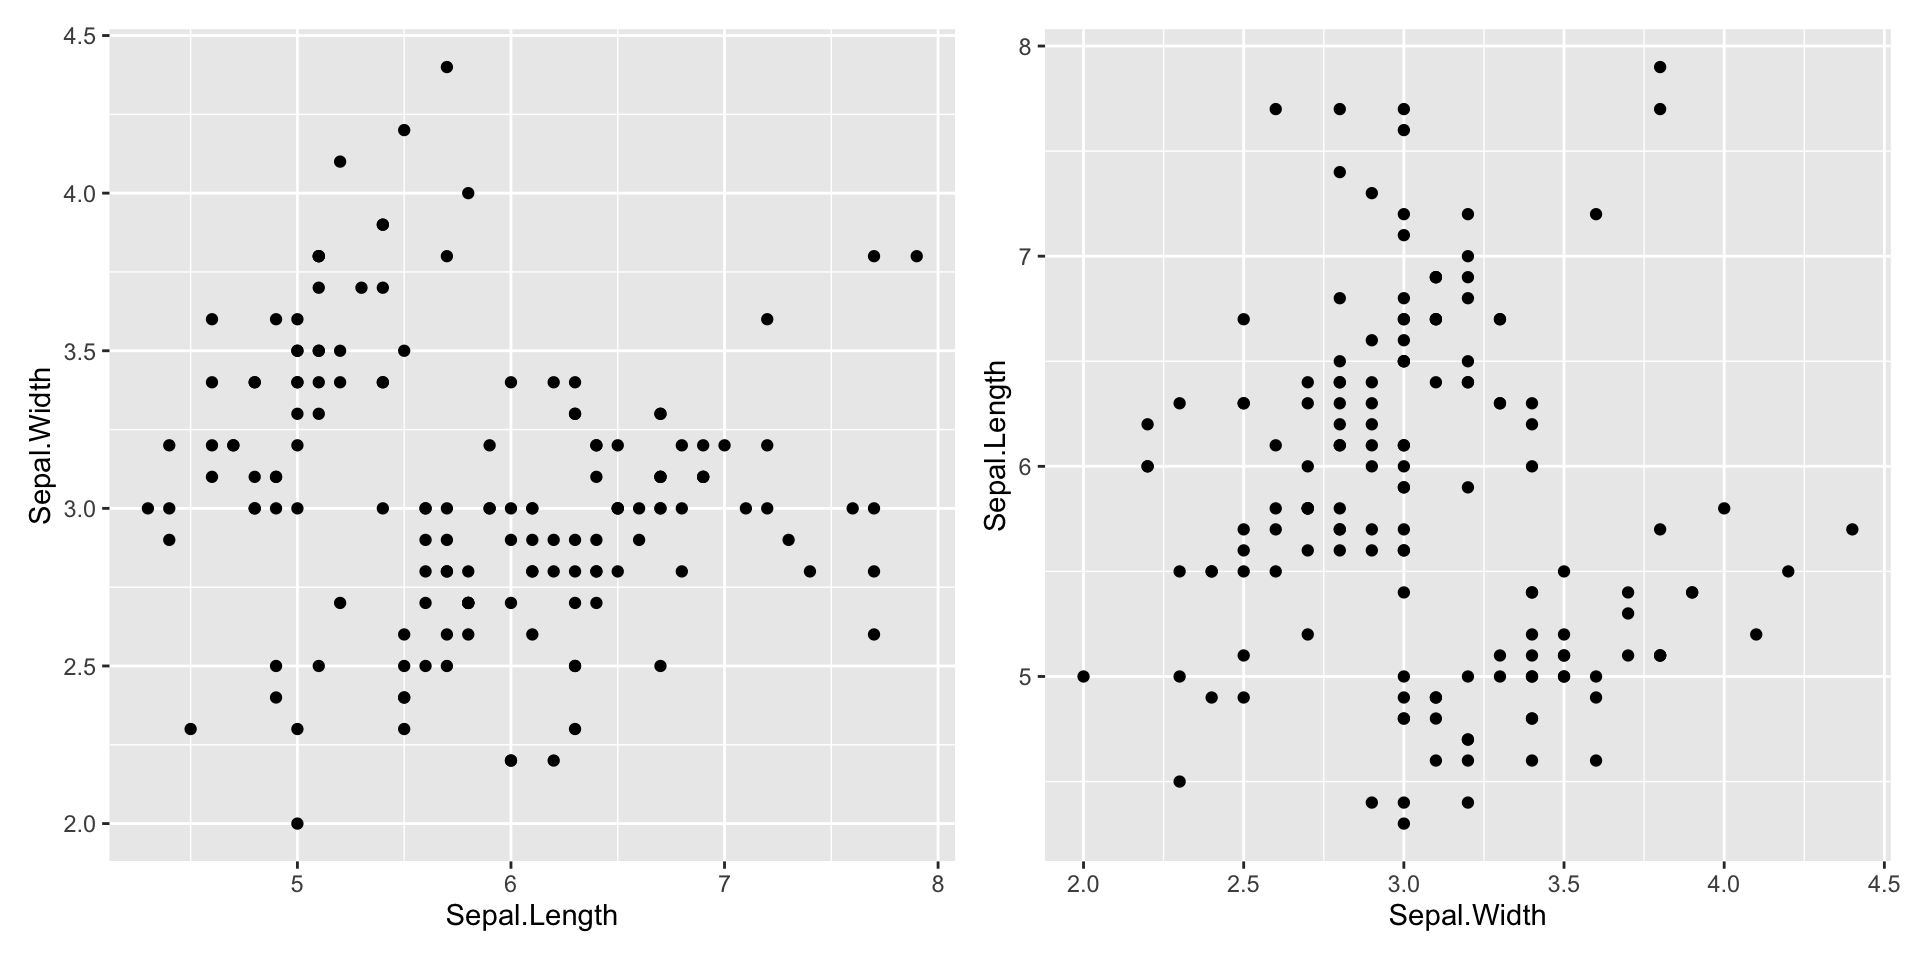
- Pair plots for “moderate” HDD
- PCA (or similar dimension reduction. Take 9890!)
FAQ: ggplot2 - Creating a Custom Theme
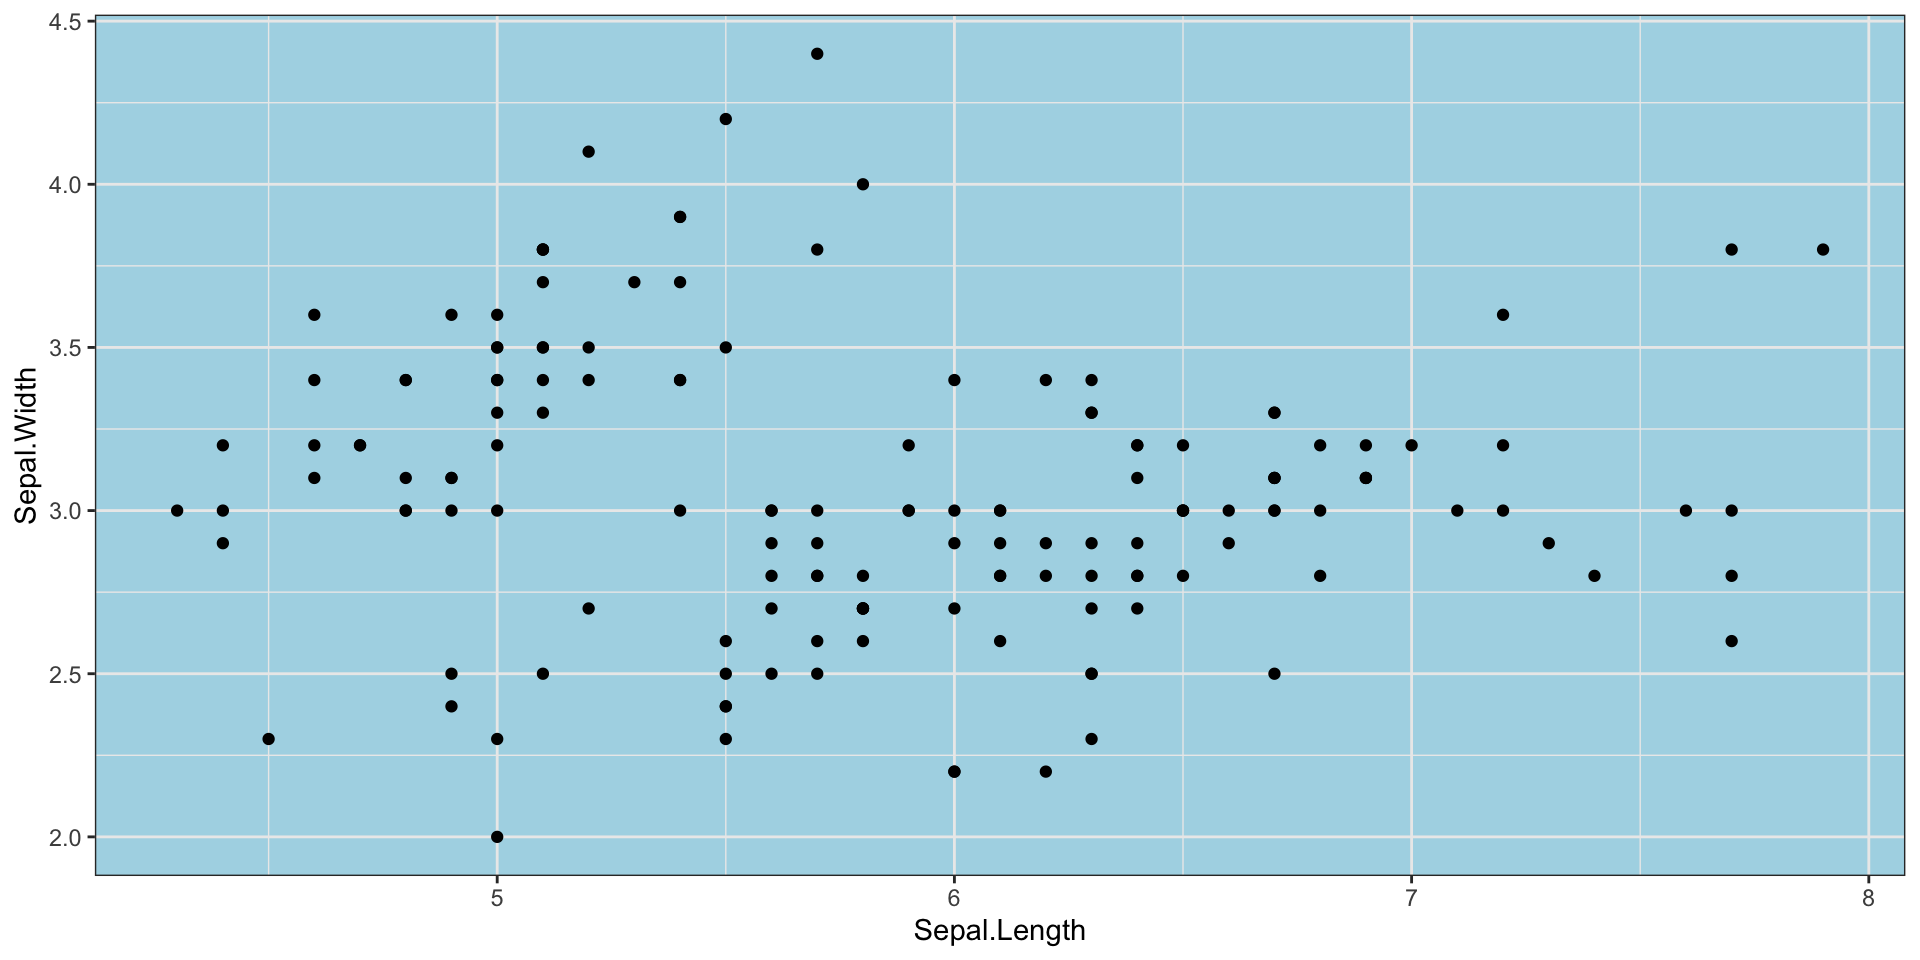
Advanced:
-
theme_set()- changeggplot2defaults -
.Rprofile- set code to run every time you startR
FAQ: ggplot2 - When Not to Use
ggplot2 is designed to make good statistical graphics. Sub-par for:
- Advanced interactivity
- Really big data
- Hardcore customization / “infographics”
FAQ: git WTF
Reference: Happy Git with R
Today
Warm-Up
“Datasaurus Dozen”:
-
install.packages("datasauRus")(Note capitalR) library(datasauRus); data(datasaurus_dozen)
Create an animated (gganimate) plot:
- \(x, y\) scatterplot
- Animate different values of
dataset
If you are having trouble with gganimate, facet instead.
Warm-Up

Diving Deeper with ggplot2
Today: maps!
Install the sf package: Simple Features for Spatial Data
Exercise: Lab #08
Breakout Rooms
| Room | Team | Room | Team | |
|---|---|---|---|---|
| 1 | Rat Pack | 6 | Ca$h VZ | |
| 2 | Subway Surfers | 7 | Listing Legends | |
| 3 | Chart Toppers | 8 | TDSSG | |
| 4 | Metro Mindset | 9 | Broker T’s | |
| 5 | Apple Watch | 10 | EVengers |