STA/OPR 9750 - Week 13
STA/OPR 9750 Mini-Project #04
Congratulations! Done with Mini-Projects!
Peer reviews to be assigned by EoW
Week 13 Pre-Assignment
Due at midnight tonight - take a moment to do it now if you haven’t already!
- Reflection on course:
- How far have you come?
- What have you learned?
- What was helpful? What was unhelpful?
Done with pre-assignments!
This is in addition to the Baruch central course assesments.
Week 13 Pre-Assignment
Used to improve future course offerings. This semester:
- Added a second round of project feedback
- Help students “scope” projects suitably
- More applied analytics than programming exercises in HW
- Other programming resources already online;
- Many students have prior experience (Python, SQL)
- More interest in Analytics than Software Engineering
- Added GitHub and Portfolio Construction
- Give students evidence of skills to share with employers
Grading
Returned:
- Mid-Term Check-In Feedback
We owe you:
- MP#03 Grades in Brightspace
Upcoming
December 12 - Last Day of Class!
- Final Project Presentations
Review the Rubric!
Non-Technical Presentation - Think of yourself as a “consultant” asked by a client to investigate a topic.
Final Project Presentations
Example Presentation Structure:
- Motivation
- How your work relates to other previous work
- Overarching Question
- Discussion of Data
- Where? How good is it? Weaknesses / Limitations?
- Specific Questions
- How do they support overarching question?
- What did you do? What did you find?
Final Project Presentations
Example Presentation Structure (continued):
- Integration of Findings
- Major Conclusions
- How do quantitative specific findings provide qualitative insights?
- What can you see be combining specific questions that you can’t see from a single specific question?
- Including Limitations of Current Study
- Potential Future Work
Final Project Reports
Group and Individual Reports
- Submitted via GitHub and Brightspace
Deadline extended to the day of the ‘final’
Registrar’s office has not released Final Exam schedule … grumble, grumble
Tentatively: December 19th
- Will confirm when exam schedule released
No late work accepted (I have to submit grades!)
Peer Assessment
On Brightspace, I have opened an additional quiz for peer evaluation of your teammates.
- 8 questions: scale of 1 (bad) to 3 (great)
Please submit a copy for each of your teammates.
- Brightspace set to allow multiple submissions.
- Due on same day as reports
If you don’t submit these, you will receive a 0 for your peer evaluations
No late work accepted (I have to submit grades!)
Final Project Grading
Rubric is set high to give me flexibility to reward teams that take on big challenges
Hard rubric => Grades are curved generously
Multiple paths to success
If your problem is “easy” on an element (data import in particular), that’s great! Don’t spend the effort over-complicating things. Effort is better spent elsewhere
Today
Agenda
- Predictive Modeling with
tidymodels
Adapted from (Case Study)[https://www.tidymodels.org/start/case-study/]
Breakout Rooms
| Order | Team | Order | Team | |
|---|---|---|---|---|
| 1 | Rat Pack | 6 | Ca$h VZ | |
| 2 | Subway Surfers | 7 | Listing Legends | |
| 3 | Chart Toppers | 8 | TDSSG | |
| 4 | Metro Mindset | 9 | Broker T’s | |
| 5 | Apple Watch | 10 | EVengers |
tidymodels
Strength of R:
- Thousands of authors contributing packages to CRAN
Weakness of R:
- Thousands of authors contributing slightly incompatible packages to CRAN
No two modeling packages have exactly the same API. Makes changing between interfaces cumbersome
tidymodels
tidymodels attemps to provide a uniform interface to a wide variety of predictive Machine Learning tools
Advantages:
- Easy to swap out different algorithms to find the best
Disadvantages:
- Harder to take advantage of the strengths of each approach
I have dedicated my academic life to the differences in these methods, but 99% of the time, “black-box” prediction is good enough. In STA 9890, we get into the weeds - not here.
ML vs Statistical Pipelines
Statistics / Data Science:
- Find the model that fits the data best
- Model should capture all important data features
- Interpretability
- History: Grounded in lab sciences where experiments are expensive and data is limited
ML vs Statistical Pipelines
Machine Learning:
- Find the model that predicts the data best
- No “perfect” model - just the best one we’ve found so far
- Black-box techniques are great, if effective
- History: Silicon Valley “at scale”
Validation based on of-of-sample or test predictions
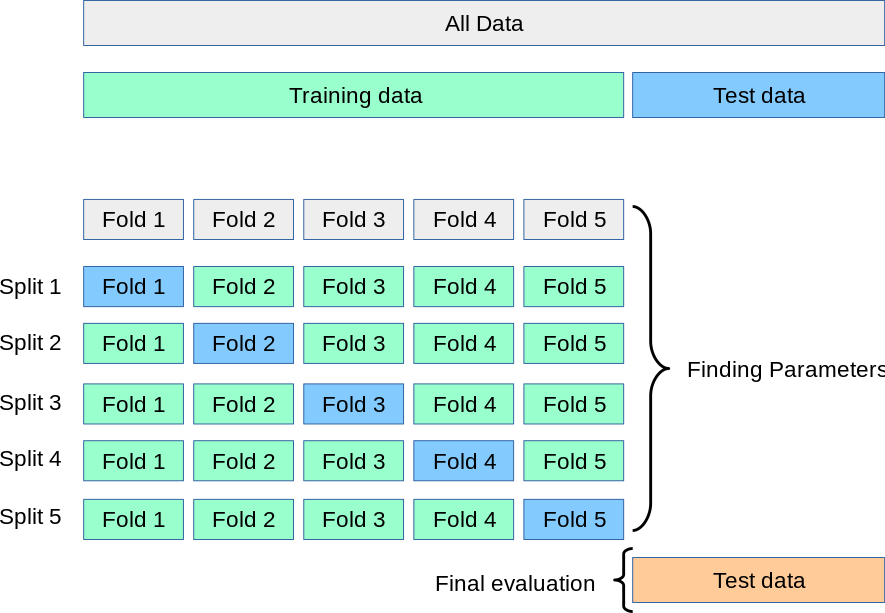
Validating Predictive Power
How to check whether a model predicts well?
Need more data! But where to get more data?
- Actually get more data (hard, expensive, slow)
- Split data into parts - test/training split
- Cross-Validation
- Resampling
Today, we’ll primarily use a combination: Test/Train split & Cross-Validation!
Cross-Validation

Cross-Validation is done on the estimator, not the fitted algorithm
tidymodels
tidymodels workflow:
- Initial Split
- Pre-Process
- Fit (many) models
- Select best
- Refit
- Test Set Assessment
tidymodels is very punny, so a bit hard to tell which step is which…
Initial Split
Pre-Process
holidays <- c("AllSouls", "AshWednesday", "ChristmasEve", "Easter",
              "ChristmasDay", "GoodFriday", "NewYearsDay", "PalmSunday")

recipe <-
  recipe(children ~ ., data = hotel_other) |>
  step_date(arrival_date) |>
  step_holiday(arrival_date, holidays = holidays) |>
  step_rm(arrival_date) |>
  step_dummy(all_nominal_predictors()) |>
  step_zv(all_predictors()) |>
  step_normalize(all_predictors())
Fit Models
Select Best
Find a grid of parameters
Perform CV splits:
Select Best
Define a workflow:
Fit workflow to a grid of parameters:
Select Best
Visual examination
Select Best
Refit
Test Set Assessment
Exercise
Work through the random forest components of https://www.tidymodels.org/start/case-study
You’ll need to work through the data import elements as well
Other tidymodels tools
- Model Stacking
- Probabilistic Predictions
- Uncertainty Bounds (Conformal Inference)
- Multilevel (Mixed-Effect) Models
- Fairness Audits
More Reading
https://www.tidymodels.org/start/