[1] "Mario" "Peach" NA "Bowser"STA 9750
Week 9 Update
2025-04-03
Michael Weylandt
Agenda
Today
- Administrative Business
- Brief Review: Flat Files and Plain Text Formats
- New Material: Accessing Data from Web Sources
- Wrap Up and Looking Ahead
Orientation
- Communicating Results (
quarto) ✅ -
RBasics ✅ - Data Manipulation in
R✅ - Data Visualization in
R✅ - Getting Data into
R- Flat Files and APIs ⬅️
- Web Scraping
- Cleaning and Processing Text
- Statistical Modeling in
R
Special Welcome
Today we welcome Prof. Ann Brandwein to our course.

Advisor for MS Stat and MS QMM. If you don’t already know Prof. B, you should!
Administrative Business
STA 9750 Mini-Projects
- Mini-Project #01 (2025-03-05 at 11:45pm ET)
- Submission ✅
- Peer Feedback ✅
- Mini-Project #02 (2025-03-26 at 11:45pm ET)
- Submission ✅
- Peer Feedback 🔄
- Mini-Project #03 (2025-04-23 at 11:45pm ET)
- Submission ⬅️
- Mini-Project #04 (2025-05-07 at 11:45pm ET)
Mini-Projects #01 and #02
Thank you for hard work on MP#01 and MP#02!
These are the ‘bigger’ projects
- Now we slow down to give you time to focus on final projects
Mini-Project #02
I’m glad to see y’all having fun with these

“People may be getting burned alive on our subways, but at least we’re stopping our riders from burning all that carbon,” said Don Vitiatus, CEO of the MTA, following Jay-Z’s heartfelt rendition of Empire State of Mind.
Peer Feedback from MP#01
Peer feedback meta-grades from MP#01 released. Currently reviewing MP#02
Some general comments:
- No jerks😀
- Feedback was generally on the money
- Try to be more specific in feedback
- Stick to template format (thank you!)
STA 9750 Mini-Project #03
Now Online
Due 2025-04-23 at 11:45pm ET
GitHub post (used for peer feedback) AND Brightspace
Three Weeks: don’t wait until the very end
-
Should be much less demanding than MP #01 and MP#02
- Major aim: getting (clean) web data into
R - Secondary aim: ‘rectangling’ JSON data
- Major aim: getting (clean) web data into
Pay attention to the rubric
Remaining Mini-Projects
- MP#04: Exploring Recent US Political Shifts

STA 9750 Course Project
Proposal feedback a few weeks back - good offline follow up - come to OH to discuss
Next Week: Mid-Term Check-In Presentations
- 6 minutes
- Locking in on specific questions
- Engagement with existing literature
STA 9750 Course Project
Sharing private comments to one group:
[On spatial subdivisions] It’s hard to say what level you should work at, but the general rule is small as possible. Students often think high resolution (lots of small regions) is harder, but it’s actually much easier. You get more data (there are more ZCTAs than boroughs) and there is more homogeneity within each unit so it’s easier to identify effects.
Big data is hard for computers but easy for analysis. Small data is what makes doing statistics hard.
STA 9750 Course Project
Sharing private comments to one group:
Data Quality: It is useful to distinguish two things here:
- Is the data representative and useful? Is the survey designed to actually answer the question you want based on the relevant population? Is the sampling actually scientific and represenative or will it have its own biases. Meta question: Does this data actually do what I need it to do?
- Is the data recorded well? Are there tons of missing data? Are there outliers you need to handle? Etc. Meta question: Does this data actually do what it claims to do?
STA 9750 Course Project
Sharing private comments to one group:
As you read prior literature, you should be asking yourself “what are we adding?” If you find someone who has done exactly what you have done, why are you wasting your time? The novelty of your work can be temporal (redoing an old analysis on new post-Covid data), spatial (recreating a Chicago study in NYC), data-source (using new data to confirm a prior finding) or methodological (using new statistical and visualization techniques to study an old problem), but fundamentally you need to be able to answer “Why would someone hire me to do this? Why is this worth my time to do it and my audience’s time to hear about it?” (These are not the only options for novelty, just some axes students have used in the past.)
STA 9750 Course Project
Sharing private comments to one group:
The activities of this class are programming related - but the point of the class is to give you the analytical tools to achieve your goals. These are mainly code things, but analytical tools also encompasses modes of thought and critical thinking. (That’s why I try so hard to ‘model’ good analysis in the mini-projects.) You aren’t required to make the step of moving beyond pure descriptive (correlation) analysis to causal claims, but if you go for it, I want you to do it in the very best way possible.
Pre-Assignments
Brightspace - Wednesdays at 11:45
- Reading, typically on course website
- Brightspace auto-grades
No Pre-Assignment for Next Week (Presentations)
Thank you for FAQs and (honest) team feedback. Keep it coming!
Course Support
- Synchronous
- Office Hours 2x / week
- MW Office Hours on Tuesday + Thursday
- No OH during Spring break
- Office Hours 2x / week
- Asynchronous
- Piazza (\(19\) minute average response time)
Upcoming Week
- Mid-Semester Project Check-Ins
Brief Review
Flat / Plain Text Files
‘Plain text’ files:
- Simple human readable and human writeable file formats
- Not specific to one piece of software
- Examples: CSV, txt, TSV
- Anti-Examples: docx, pdf, jpg
Read into R with readr functions (e.g., read_csv)
Warm-Up: Reading Flat Files into R
From FiveThirtyEight
Warm-Up
Data can be found at https://raw.githubusercontent.com/fivethirtyeight/data/refs/heads/master/candy-power-ranking/candy-data.csv
Read into R (readr::read_csv) and make 3 plots:
- Do people like more sugary candy?
- Do people like more expensive candy?
- Open-Ended
Breakout Rooms
| Room | Team | Room | Team | |
|---|---|---|---|---|
| 1 | Team Mystic + B | 5 | Money Team + CWo. | |
| 2 | Subway Metrics | 6 | Lit Group | |
| 3 | Noise Busters | 7 | Cinephiles + VG | |
| 4 | AI Imp. Coll. |
New Material: Accessing Data from Web Sources
Getting Data into R
Two topics:
- How internet data transfer actually works
- How to handle non-rectangular data formats
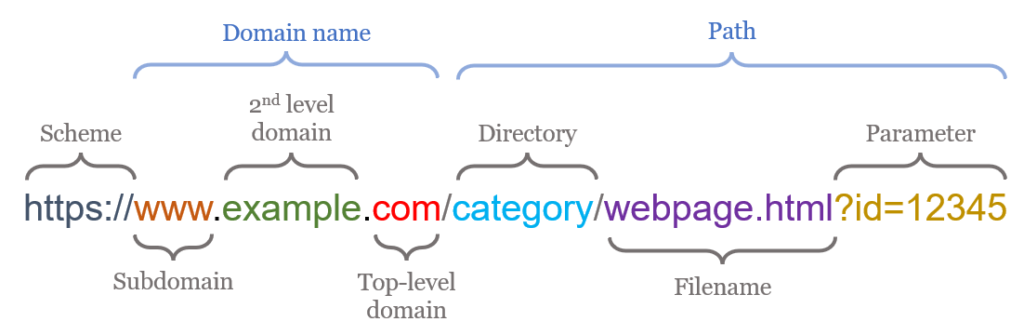
URLs
From abstrax.io
JSON
JSON:
- Short for
JavaScript Object Notation - Popular plain-text representation for hierarchical data.
- Closer to Python objects (
dicts ofdicts ofdicts) thanRdata.frames - Widely used for Application Programming Interfaces (APIs)
JSON
Example:
{
    "data": {
        "id": 27992,
        "title": "A Sunday on La Grande Jatte — 1884",
        "image_id": "1adf2696-8489-499b-cad2-821d7fde4b33"
    },
    "config": {
        "iiif_url": "https://www.artic.edu/iiif/2",
    }
}
JSON
Read JSON in R with jsonlite package (alternatives exist)
JSON
    Name Age Occupation
1  Mario  32    Plumber
2  Peach  21   Princess
3   <NA>  NA       <NA>
4 Bowser  NA      Koopa
JSON - An API Standard
$type
[1] "programming"

$setup
[1] "Why did the programmer always mix up Halloween and Christmas?"

$punchline
[1] "Because Oct 31 equals Dec 25."

$id
[1] 418
Compare to browser access
Data Transfer: download.file
function (url, destfile, method, quiet = FALSE, mode = "w", cacheOK = TRUE,
    extra = getOption("download.file.extra"), headers = NULL,
    ...)
NULL
Basic file download capabilities:
-
url: source -
destfile: where on your computer to store it -
method: what software to use in the background to download
Data Transfer: HTTP
HTTP
- HyperText Transfer Protocol
- Most common (but not only) internet protocol
- Also
ftp,smtp,ssh, …
“Low-level” mechanism of internet transfer
- Many
Rpackages add a friendly UX -
httr2for low-level work (today)
HTTP
HTTP has two stages:
- Request
- URL (Host + Path)
- Method (VERB)
- Headers
- Content
- Cookies
- Response
- Status Code
- Headers
- Content
Modern (easy) APIs put most of the behavior in the URL
HTTP in the Browser
In Firefox: Right-Click + Inspect
In Chrome: Right-Click + Developer Tools
HTTP with httr2
httr2 (pronounced “hitter-2”) is low-level manipulation of HTTP.
Pretty simple so far:
-
example_url()starts a tiny local web host -
127.0.0.1islocalhost
httr2 Requests
Build a request:
requestreq_methodreq_body_*req_cookies_set-
req_auth_basic/req_oauth
httr2 Requests
Behaviors:
req_cachereq_timeout
Execution:
req_perform
httr2 Responses
Request status
-
resp_status/resp_status_desc
Content:
resp_header*resp_body_*
Live Demo
Demo: Using httr2 to get a random joke from
Exercise - CRAN Logs API
See Lab #09